
PUBLIC RELATIONS
Monday 23rd May 2022
What are the most popular Key Performance Indicators in PR?
What are the most popular PR metrics? What are the latest trends in measurement? How closely does our industry truly adhere to best practices? We analysed over 400k metrics to find out.
Most attempts to answer questions like these are based on anecdotal evidence, hearsay or opinion and for good reason. It’s actually really hard to know how other PR professionals measure their work behind closed doors, away from the prying eyes of industry standard bearers like AMEC.
And yet, wouldn’t it be fascinating to learn what your peers are choosing to measure (and not measure)? Is it still all about coverage or is there more to modern PR? Have AVE measurements survived the industry attempts to kill it off? And have any inroads been made in terms of evaluating meaningful Outcomes and Impacts as recommended by AMEC.
It occurred to us that we were in a unique position to get some genuine answers to those questions using real-world data.
Since 2015, thousands of PR professionals across the world have been using Releasd to create reports that showcase the full breadth of their activities. They’ve been sharing media coverage, social posts, event summaries, content, supporting plans and more with their clients and executives. And they have the ability to create their own, custom KPIs within these reports. And that’s what they’ve done: over 400,000 of them in fact!
So, we dug into the data and created a report entitled ‘What are the most popular KPIs in PR?’, to share our findings and answer some of those intriguing questions. Let’s have a look at some of the key takeaways:
- Measurement of non-media relations activities (organising events, creating content, booking guest posts etc) saw the biggest jump over time. 77% of reports created in 2021 included Activity-based metrics compared to just 19% in 2015.
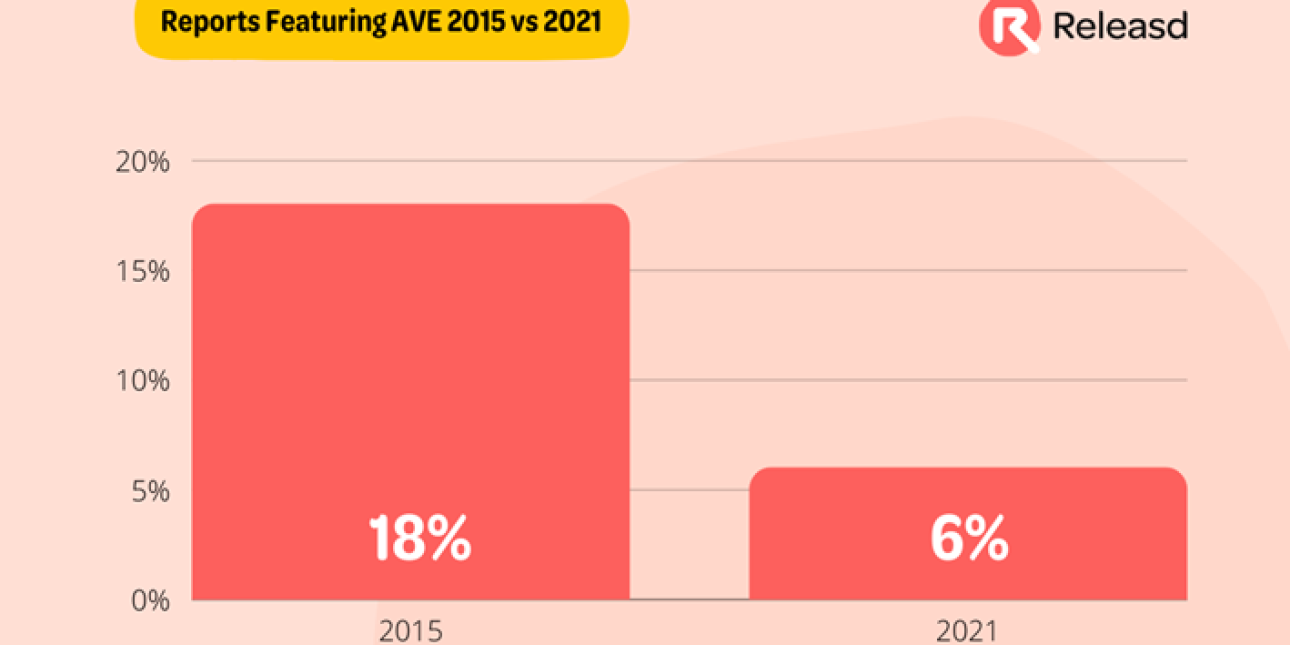
- AVE (or, to use its more modern and sinister title, ‘PR Value’) is still alive, but only just. Usage has decreased year on year with only 6% of reports including this metric in 2021, compared to 18% in 2015.

- Out-take metrics remain extremely popular. 92% of Releasd reports in 2021 featured cutting edge analytics such as coverage views, live coverage shares and dark social media engagement.
- There’s still much to do in terms of Outcome and Impact evaluation. Reports shared with SMEs were most likely to include at least one Outcome or Impact based KPI, but even in this category only 16% of reports included such a metric.
OK, so let’s dive into these results. What do they actually mean?
The dramatic expansion of Activity-based metrics may initially feel like cause for concern. Should the industry really be putting so much effort into measuring the busy work that’s done behind the scenes?
Upon deeper examination of the data, we see that PRs are simply providing more services to their clients or organisations than they ever have before. Gone are the days when media relations was all the industry could offer. This diversification should be seen as a positive and explains why there are many more things to measure in this area.
AVE is alive!
It’s also worth noting the reduction in AVE usage over the years. Lobbying from AMEC and other bodies has clearly had an impact. Interestingly, the data shows that in-house teams are much more likely to employ the metric than agencies.
Our own conversations with customers confirm that stakeholders outside of the communications function often demand a dollar/pound amount on their investment, despite protestations from PRs and the mountains of evidence that AVE is nonsense.
More metrics
There has been an explosion in the quality and quantity of metrics across the board in PR, some (but not all) of which truly help to paint a picture of how a story is being received by its audience. Coverage-level views, live social engagement and similar data points are now available and have become hugely popular, in some part because they imply that the work done is making a difference. They may imply, but they certainly can’t confirm.
Outcomes and Impacts
Which brings us to Outcomes and Impacts, which are all that really matter in the end. Have your communications triggered meaningful actions, or led to long-lasting change?
Our research shows that there has been some progress in this area, but there is a long way to go. Interviews with customers revealed that there are three things that need to be in place in order to ascertain whether the work done has genuinely moved the needle:
- An understanding of the aims of the work.
- An awareness of what is actually achievable.
- Access to the right tools and teams to capture the data.
This in part explains why reports shared with SMEs were most likely to include such KPIs. They seem most likely to be in a position to fulfil the requirements above, in particular, an ability to grant access to the necessary platforms and people, which is a sticking point for enterprise organisations.
You can see the full results of our report by downloading our ‘What are the most popular KPIs in PR?’ report.
Richard Benson is the Founder of Releasd
Image by metamorworks on iStock