

What is the CIPR’s carbon footprint?
When the Institute sought to measure its emissions, it made a surprising discovery…
442.89 tonnes of C0₂ equivalent – that is the answer to the question we began searching for last year, when we selected ESI Monitor as our measurement partner to determine the carbon footprint of the CIPR. We selected 2017 as our starting year.
The figure is about average for a small office-based organisation in the UK, but it does contain a surprise. As some members will recall, back in 2017 we still occupied two large Victorian houses on London’s Russell Square. My expectation was that by moving out and transitioning to a virtual organisation, we would already have achieved a significant reduction in our emissions. Not so.
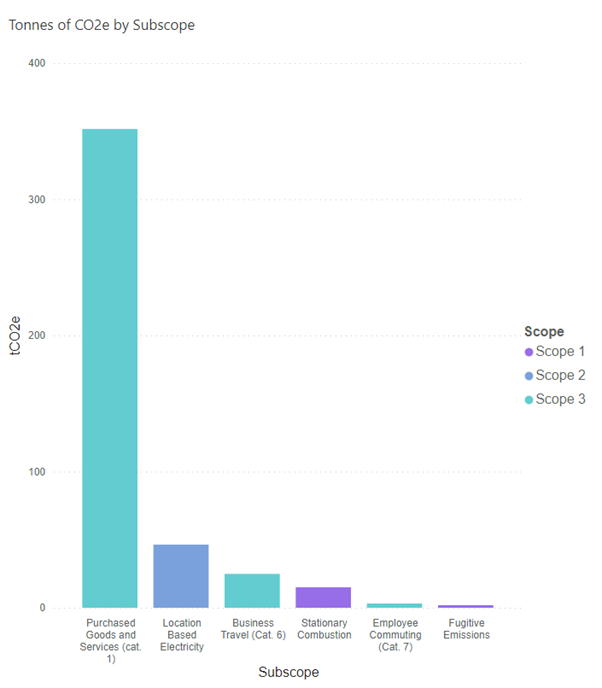
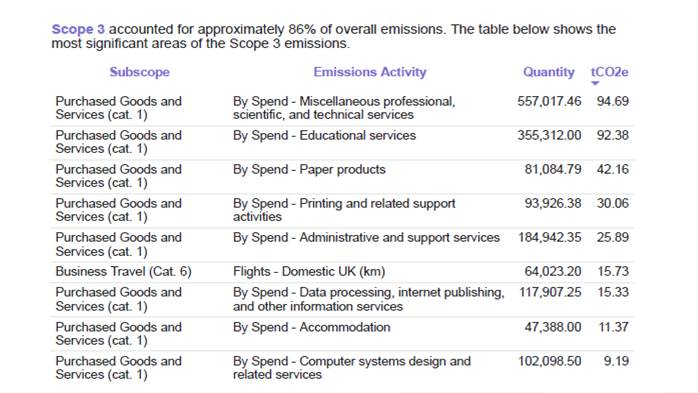
For 2017, our estimated scope 1 emissions (direct combustion – ie gas we used to heat the building) amounted to just 3.82% of our overall emissions, and our scope 2 emissions (electricity) were just 10.47% of our total. A whopping 85.71% of our emissions came from Scope 3 (predominantly purchased goods and services). So, it turned out that moving out of Russell Square didn’t have a particularly big impact on our emissions at all. This means, of course, that there is more work ahead of us to get our footprint down than I had originally expected.
Measuring 2022
The next step for us will be to measure emissions for 2022. This will let us see the impact of several changes we have made over the last five years – becoming a virtual organisation, ending the production and distribution of a printed magazine, and moving many of our meetings from face to face to virtual. Our 2022 figures should be lower than our 2017 footprint, but the bulk will remain – the energy expended in goods and services we purchase to run the Institute. Getting those down is going to be a long, slow task.
Fortunately, in 2022 we also established a new environmental, social, and governance (ESG) panel of volunteers. I hope they will be able to help us identify some of the steps we need to take in order to meet our Committed Business pledge to halve our emissions by 2030 (from our 2022 figure). While we work that out, we will also look for a reputable UK-based offsetting scheme that we can use to mitigate our climate impact.
I am very grateful to my colleague Eva Mota, who resolutely worked through many archive boxes of finance records to pull together the data that went into this report. It certainly wasn’t a labour of love but going forward we will be using ESI Monitor’s new online FutureTrack self-reporting tool, which will make the whole process of data gathering much less painful.
We will be reporting on our carbon emissions in our 2022 annual report and will continue to do so annually after that. From 2022 we will also begin doing a full ESG report as well.
Suzy Giles MCIPR, co-chair of the CIPR ESG Group, commented: “It’s great to see the CIPR tracking its emissions with a commitment to improve the transparency of its data as it manages the move across recent years from a fixed office to more remote working. As an organisation which represents integrity and professionalism in communications it’s great to see this first step in their sustainability journey.”

Alastair McCapra is chief executive of the CIPR.